17th August 2011
Ryan from Mixmakers.net passed along some links that you might enjoy:
- Rare. Air. - A great collection of black & white photos from Michael Jordan's career
- '96 Bulls Highlights (Part I) - Want to watch highlights of every game from the Bulls' 1996 season? That's the place to start. I swear I'm going to watch them all back-to-back at some point.
Posted in History, Layups, YouTube Finds | 7 Comments »
16th August 2011
Nathan emailed us this question today:
"I stumbled across the 97-98 Cavaliers page for some reason and noticed that during that season they started Wesley Person, Shawn Kemp, Cedric Henderson, Zydrunas Ilgauskas and Brevin Knight, with Derek Anderson starting 13 games. So that's 8th-year player Kemp, 3rd-year player Person, and 4 rookies in the top 6 in terms of starts! And they made the playoffs!
That has to be the highest percentage of games started by rookies right (discounting the first few seasons of the NBA)?"
Unfortunately our complete start data only goes back to 1983, so I can't speak to teams from early in the NBA's existence (except to say that, obviously, everyone would be a rookie in 1949-50). Since 1983, though, here are the teams that gave the most starts to 1st-year players:
Read the rest of this entry »
Posted in BBR Mailbag, History, Trivia | 15 Comments »
27th July 2011
If you've been following the blog recently, I've developed a way to convert a player's Basketball on Paper stats to a Statistical Plus/Minus estimate. I'll spare you the gory details (which you can read about at the bottom of this page), and simply say that this version of SPM is less biased toward any one position and captures defense better than the original edition, making it the superior SPM in my opinion (although, as always, I'm certainly open to critiques).
Read the rest of this entry »
Posted in Analysis, History, Insane ideas, Statgeekery, Statistical +/- | 83 Comments »
22nd July 2011
Quick mailbag for Nick, who asked how many games in each season (since 1999) featured at least 1 team playing its second game in two nights:
1999: 392 of 725 (54.1%)
2000: 494 of 1189 (41.5%)
2001: 481 of 1189 (40.5%)
2002: 504 of 1189 (42.4%)
2003: 487 of 1189 (41.0%)
2004: 475 of 1189 (39.9%)
2005: 500 of 1230 (40.7%)
2006: 474 of 1230 (38.5%)
2007: 486 of 1230 (39.5%)
2008: 483 of 1230 (39.3%)
2009: 471 of 1230 (38.3%)
2010: 490 of 1230 (39.8%)
2011: 497 of 1230 (40.4%)
Hopefully the 2011-12 lockout will resolve quickly, so we don't have to have back-to-backs in 54% of games like in 1999 (and the 102.2 league offensive rating that came with it).
Posted in BBR Mailbag, History, Trivia | 10 Comments »
9th July 2011
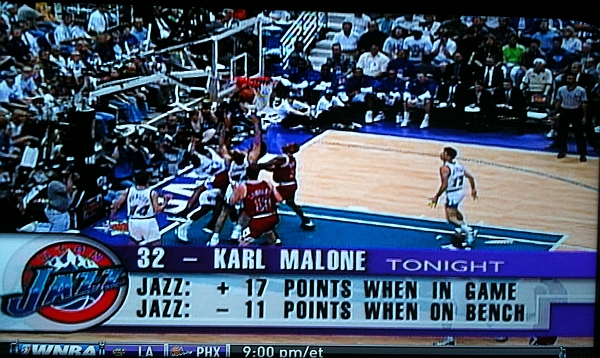
Just saw this while watching a replay of the Flu Game that I DVR-ed from a few days ago...

Proof that somebody in TV was thinking about on/off-court plus-minus as early as 1997.
Posted in History, Just For Fun, Statgeekery | 19 Comments »
27th June 2011
BBR user Kenneth asked:
"I have a question regarding players and coaches with NBA titles--which player(s) and coach(es) have won NBA titles with the most teams? As for players, I suspect Robert Horry, who won titles with the Houston Rockets (2), Los Angeles Lakers (3), and San Antonio Spurs (2), unless another player has won titles with four teams."
Right you are, Kenneth (although, like many people, you forgot about John Salley). Here are all the players and coaches who won championships in the same role with multiple teams:
Read the rest of this entry »
Posted in BBR Mailbag, History, Playoffs, Trivia | 32 Comments »
9th June 2011
With the NBA Finals locked up 2-2, it seems like a good time to look at the best Finals performances in our database (which extends back to 1991 for playoff games). The metric of choice is Statistical Plus-Minus, an estimate of the player's contribution to the team's point differential per 100 possessions, using his boxscore stats as inputs. And, as an added twist, I weighted each game of the Finals according to its series leverage (the expected change in series win probability of the game in question relative to the series' overall average per-game change), meaning that performance counts more in the games that contain the most pressure. Here is every player in the dataset who played a minimum of 24 minutes per team game:
Read the rest of this entry »
Posted in Analysis, Data Dump, History, Playoffs, Statgeekery, Statistical +/- | 26 Comments »
7th June 2011
Ranking the greatest series ever: At ESPN, John Hollinger concocted a formula to rank the 50 best playoff series since the NBA-ABA merger.
Posted in History, Layups, Playoffs | 6 Comments »
6th June 2011
NBA Championship Rings by Teams 1947 – 2010: Check out Hoopism's visual history of every NBA championship ring.
Posted in History, Layups, Playoffs | 4 Comments »
2nd June 2011
Keeping Score: They Won a Lot of Games, and Soon a Title
At the NY Times, I highlight the unprecedented group of superstars currently seeking their first ring.
Posted in History, Layups, NY Times, Win Shares | 4 Comments »

