27th July 2011
If you've been following the blog recently, I've developed a way to convert a player's Basketball on Paper stats to a Statistical Plus/Minus estimate. I'll spare you the gory details (which you can read about at the bottom of this page), and simply say that this version of SPM is less biased toward any one position and captures defense better than the original edition, making it the superior SPM in my opinion (although, as always, I'm certainly open to critiques).
Read the rest of this entry »
Posted in Analysis, History, Insane ideas, Statgeekery, Statistical +/- | 83 Comments »
25th July 2011
Which players excel against the best defenses, and which ones get their numbers by feasting on the weakest Ds?
To answer those questions, here's the latest installment of a series I started in 2009 and continued in 2010... The concept is simple: I rate each team defensively using the BBR Rankings formula (including regular-season and playoff games), then track how well each player performed offensively against opponents of varying defensive quality.
Read the rest of this entry »
Posted in Analysis, BBR Rankings, SRS, Statgeekery, Statistical +/- | 44 Comments »
11th July 2011
As a follow-up to this afternoon's list of the Top 593 Players of 2012, here's a positional breakdown for the 452 players who played at least 1 game in 2011:
Read the rest of this entry »
Posted in Insane ideas, Just For Fun, Projections, Statgeekery, Statistical +/-, Win Shares | 66 Comments »
11th July 2011
(Note: File this squarely under "Insane Ideas".)
Watching one of the NFL Network's "Top 100 Players of 2011" shows this weekend, I was inspired to create a similar list for the NBA using APBRmetric stats. But why stop at 100? Instead, I ranked all 593 players who played at least 1 NBA game since 2008-09.
Read the rest of this entry »
Posted in Insane ideas, Just For Fun, Projections, Statgeekery, Statistical +/-, Win Shares | 35 Comments »
9th July 2011
Here's a quick-n-dirty study I ran this morning... The idea is this:
Some stats seem to be more correlated with a player's role than his actual skill. Take a player out of the role, plug another similar player in, the new player produces just like the old one (and the old one can't "take the stats with him" to his new destination).
How can we quantify this, though? Well, let's identify players whose circumstances changed. I took every team since 1978 and assigned its players to 10 "roles" -- primary PG, backup PG, primary SG, etc. -- based on my detailed position file and where the players ranked on the team in terms of minutes played. I then isolated every player in that sample who:
- Played at least 500 minutes in back-to-back seasons
- Was between age 24 and 34 in back-to-back seasons (to filter out potential aging effects)
- Moved to a new "role"
- Was replacing a player who played >= 500 MP in the role and was between age 24 and 34 the previous season
This leaves us with 1,866 player-seasons to look at. For each of those, I need to know which predicts the player's performance in Year Y better -- his own stats from Year Y-1, or the Year Y-1 stats of the player whose role he took?
Read the rest of this entry »
Posted in Analysis, Insane ideas, Statgeekery, Win Shares | 9 Comments »
9th July 2011
Just saw this while watching a replay of the Flu Game that I DVR-ed from a few days ago...
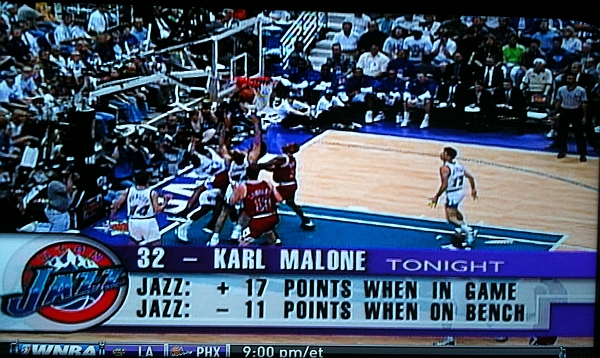
Proof that somebody in TV was thinking about on/off-court plus-minus as early as 1997.
Posted in History, Just For Fun, Statgeekery | 19 Comments »
12th June 2011
Dallas' Series Win Probability Graph after Game 6 (Dallas wins series 4-2):
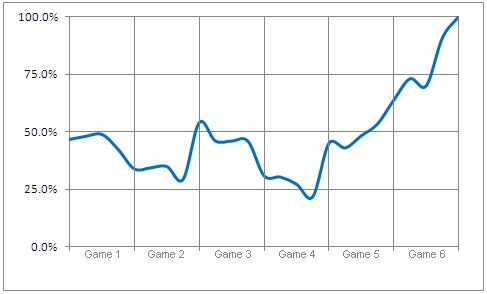
Dallas' Quarter-by-Quarter Series Win Probability Data:
| Minutes Elapsed |
p(win) |
| 0 |
46.7% |
| Game 1 |
| 12 |
48.0% |
| 24 |
48.8% |
| 36 |
42.3% |
| 48 |
33.8% |
| Game 2 |
| 60 |
34.3% |
| 72 |
34.9% |
| 84 |
29.3% |
| 96 |
54.0% |
| Game 3 |
| 108 |
46.0% |
| 120 |
46.0% |
| 132 |
45.9% |
| 144 |
30.9% |
| Game 4 |
| 156 |
30.3% |
| 168 |
27.2% |
| 180 |
21.7% |
| 192 |
45.0% |
| Game 5 |
| 204 |
43.0% |
| 216 |
48.3% |
| 228 |
53.4% |
| 240 |
63.7% |
| Game 6 |
| 252 |
73.0% |
| 264 |
69.9% |
| 276 |
90.7% |
| 288 |
100.0% |
(For more info on the Series Win Probability methodology, click here)
Posted in Playoffs, Statgeekery | 101 Comments »
12th June 2011
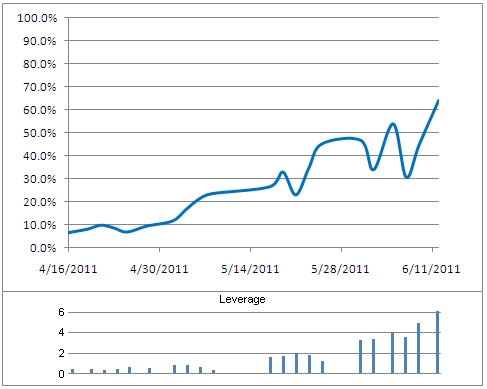
Here are a couple of graphs showing the game-by-game progression of Dallas & Miami's championship probabilities as they moved through the playoffs:
Dallas Mavericks
Miami Heat
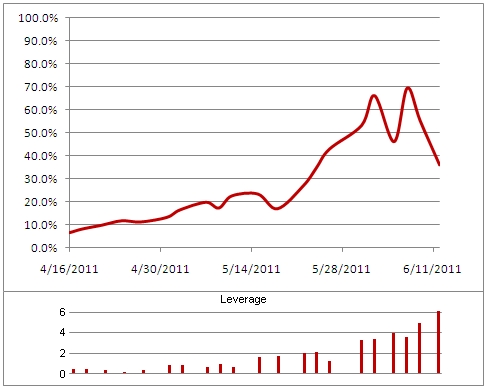
("Leverage" is the importance of the game relative to the average playoff game, which always has a leverage index of 1.00)
Posted in Graphs, Playoffs, Statgeekery | 6 Comments »
12th June 2011
As a follow-up to Thursday's post about the best Finals performances according to Statistical Plus/Minus, here's a playoff ranking since 2003 with a few tweaks:
- I finally re-ran the Offensive SPM formula without steals and blocks. Steals in particular were causing certain players to be extremely overvalued offensively, and there's little reason to include those defensive stats in an offensive regression. (DSPM is the same as before -- and yes, it still includes several offensive stats, but DSPM wouldn't explain more than 25% of defense without them, while OSPM's explanatory power was barely affected by dropping steals & blocks out.)
- At the request of readers, instead of per-minute SPM players are ranked by per-game "Impact", which is SPM times the % of team minutes played.
- All of a player's games are weighted by Championship Leverage, which takes into account how much the game will potentially swing the odds of a team winning the NBA title. Leverage is relative to the average playoff game in a given season (which always has a leverage index of 1.00). For instance, Game 1 of the Magic-Hawks 1st-round series had a leverage of 0.44, while Game 5 of the Finals had a leverage of 5.28. This means that, in terms of influence on championship probability, Thursday's game was 12 times as important as Game 1 of a 1st-round series, and the rankings will reflect this.
Finally, why 2003? Because that was the year the NBA adopted best-of-7 first-round series, allowing me to use the series win probabilities found here.
Anyway, here were the top playoff performers since 2003 according to per-game SPM impact, weighted by the importance of the game (minimum 10 games):
Read the rest of this entry »
Posted in Analysis, Playoffs, Statgeekery, Statistical +/- | 11 Comments »
9th June 2011
Dallas' Series Win Probability Graph after Game 5 (Dallas leads 3-2):
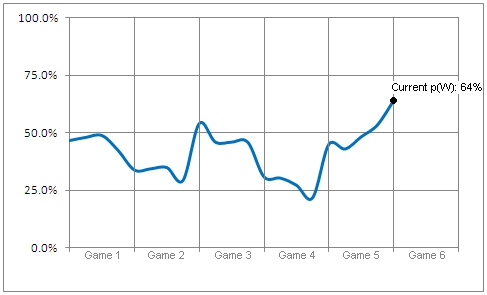
Dallas' Quarter-by-Quarter Series Win Probability Data:
| Minutes Elapsed |
p(win) |
| 0 |
46.7% |
| Game 1 |
| 12 |
48.0% |
| 24 |
48.8% |
| 36 |
42.3% |
| 48 |
33.8% |
| Game 2 |
| 60 |
34.3% |
| 72 |
34.9% |
| 84 |
29.3% |
| 96 |
54.0% |
| Game 3 |
| 108 |
46.0% |
| 120 |
46.0% |
| 132 |
45.9% |
| 144 |
30.9% |
| Game 4 |
| 156 |
30.3% |
| 168 |
27.2% |
| 180 |
21.7% |
| 192 |
45.0% |
| Game 5 |
| 204 |
43.0% |
| 216 |
48.3% |
| 228 |
53.4% |
| 240 |
64.0% |
(For more info on the Series Win Probability methodology, click here)
Posted in Playoffs, Statgeekery | 64 Comments »


