Dallas Mavericks & Miami Heat Championship Probability Graphs Through the Playoffs
Posted by Neil Paine on June 12, 2011
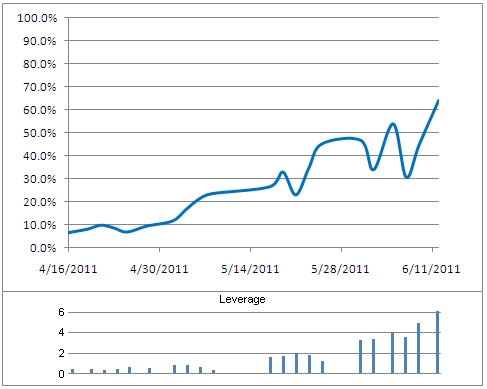
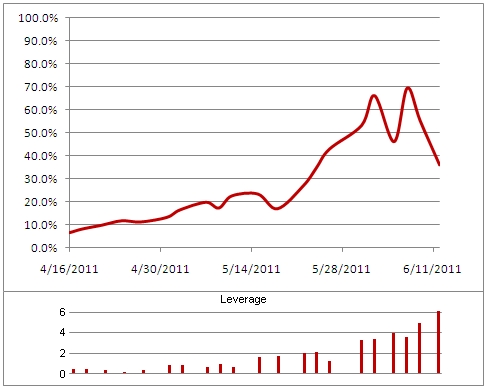
Here are a couple of graphs showing the game-by-game progression of Dallas & Miami's championship probabilities as they moved through the playoffs:
Dallas Mavericks

Miami Heat

("Leverage" is the importance of the game relative to the average playoff game, which always has a leverage index of 1.00)

June 12th, 2011 at 3:32 pm
this game 6 has such a huge leverage lebron has to come up big and have a double digit impact or else the heat are going to lose.
June 12th, 2011 at 4:37 pm
Can the X axis be changed to something other than the date? Perhaps series and game #?
June 12th, 2011 at 4:55 pm
#2 - The leverage graph underneath is supposed to help with that a little, because each bar is a game, and it maps those onto the same scale as the first graph.
June 12th, 2011 at 5:38 pm
Thanks, that does help. Do the graphs account for in game changes or just probability at the end of games? My hunch is that it is the latter, as the former would show a lot more variation. And if my hunch is right, it is probably not fully accurate to have the lines smoothed, right?
June 12th, 2011 at 8:07 pm
If they allow LeBron 4 ridiculous travels (horsey gallops, hopping, 5 step drives in the lane, etc.) AND LeBron posts up to start AND finish the game------Miami wins by double digits. Their defense has that extra day of rest and I expect them to be better as well.
June 13th, 2011 at 1:19 pm
Wade has a higher turnover rate, stop. LeBron gets to the rim because he's the most athletic player in the history of the league.