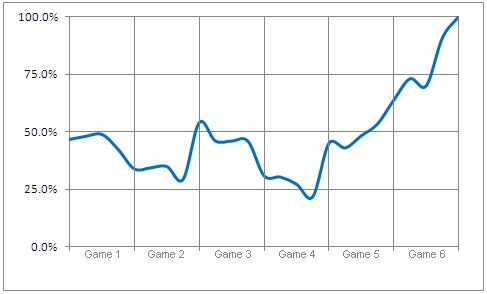
Final 2011 NBA Finals Series Win Probability Graph
Posted by Neil Paine on June 12, 2011
Dallas' Series Win Probability Graph after Game 6 (Dallas wins series 4-2):

Dallas' Quarter-by-Quarter Series Win Probability Data:
| Minutes Elapsed | p(win) |
|---|---|
| 0 | 46.7% |
| Game 1 | |
| 12 | 48.0% |
| 24 | 48.8% |
| 36 | 42.3% |
| 48 | 33.8% |
| Game 2 | |
| 60 | 34.3% |
| 72 | 34.9% |
| 84 | 29.3% |
| 96 | 54.0% |
| Game 3 | |
| 108 | 46.0% |
| 120 | 46.0% |
| 132 | 45.9% |
| 144 | 30.9% |
| Game 4 | |
| 156 | 30.3% |
| 168 | 27.2% |
| 180 | 21.7% |
| 192 | 45.0% |
| Game 5 | |
| 204 | 43.0% |
| 216 | 48.3% |
| 228 | 53.4% |
| 240 | 63.7% |
| Game 6 | |
| 252 | 73.0% |
| 264 | 69.9% |
| 276 | 90.7% |
| 288 | 100.0% |
(For more info on the Series Win Probability methodology, click here)

June 19th, 2011 at 9:01 pm
Great article.