2010 Eastern Conference Semifinals Preview: Orlando vs. Atlanta
Posted by Neil Paine on May 3, 2010
2010 Playoffs Home ▪ 2010 Playoff Previews
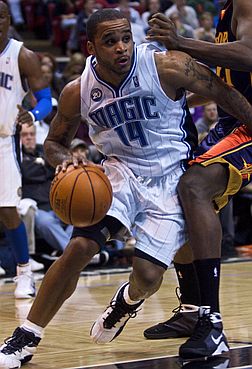
 2. Orlando Magic
Coach: Stan Van Gundy
SRS: 7.12 (1st of 30) ▪ Pace Factor: 92.0 (18th of 30)
Offensive Rating: 111.4 (4th of 30) ▪ Defensive Rating: 103.3 (3rd of 30)
How They Got Here:
Won NBA Eastern Conference First Round (4-0) versus Charlotte Bobcats
Four Factors:
| Team | eFG% | Rank | TOV% | Rank | ORB% | Rank | FT/FGA | Rank |
|---|---|---|---|---|---|---|---|---|
| Orlando Magic | 0.536 | 2 | 0.136 | 17 | 0.246 | 25 | 0.246 | 7 |
| Orlando Magic - Opp | 0.477 | 1 | 0.122 | 26 | 0.226 | 1 | 0.205 | 3 |
Roster (w/ 2010 Regular-Season Stats):
| Player | Ag | Ht | Ps | ORtg | %P | DRtg | DPA | P36 | 2P% | 3P% | FT% | AR | TR | PR | Fr | 3t | OR% | DR% | Bk% | St% |
|---|---|---|---|---|---|---|---|---|---|---|---|---|---|---|---|---|---|---|---|---|
| Rashard Lewis | 30 | 82 | SF | 110.7 | 18.3 | 104.1 | 0.51 | 15.5 | 47.6 | 39.7 | 80.6 | 7.4 | 13.0 | -1.55 | 22.4 | 52.5 | 3.1 | 12.1 | 0.9 | 1.7 |
| Vince Carter | 33 | 79 | SG | 112.1 | 24.2 | 105.3 | -0.37 | 19.5 | 45.6 | 36.7 | 84.0 | 17.8 | 9.9 | 2.22 | 30.1 | 31.9 | 1.7 | 12.6 | 0.6 | 1.2 |
| Jameer Nelson | 27 | 72 | PG | 109.8 | 23.3 | 106.1 | -1.21 | 16.0 | 48.1 | 38.1 | 84.5 | 32.1 | 16.8 | 5.18 | 16.4 | 32.0 | 1.7 | 10.1 | 0.1 | 1.3 |
| Matt Barnes | 29 | 79 | SF | 111.2 | 16.4 | 102.8 | 1.27 | 12.4 | 58.6 | 31.9 | 74.0 | 10.1 | 17.0 | -1.08 | 26.2 | 37.2 | 6.1 | 18.0 | 1.1 | 1.5 |
| Dwight Howard | 24 | 83 | C | 113.4 | 24.6 | 95.3 | 6.01 | 19.2 | 61.7 | 0.0 | 59.2 | 8.7 | 20.5 | -6.26 | 97.8 | 0.8 | 12.0 | 31.3 | 6.0 | 1.4 |
| Marcin Gortat | 25 | 84 | PF | 112.7 | 13.6 | 99.3 | 3.71 | 9.8 | 54.0 | 0.0 | 68.0 | 2.4 | 16.2 | -3.19 | 33.0 | 1.3 | 11.5 | 24.3 | 4.8 | 0.8 |
| Mickael Pietrus | 27 | 78 | SG | 105.8 | 16.8 | 104.0 | 0.33 | 14.0 | 50.2 | 37.9 | 63.3 | 4.7 | 12.7 | -2.15 | 20.2 | 56.8 | 2.8 | 11.6 | 1.4 | 1.6 |
| J.J. Redick | 25 | 76 | SG | 123.2 | 17.7 | 107.6 | -1.23 | 15.8 | 47.3 | 40.5 | 86.0 | 13.9 | 10.3 | 2.34 | 40.1 | 49.5 | 1.1 | 8.5 | 0.2 | 0.8 |
| Jason Williams | 34 | 73 | PG | 114.6 | 15.6 | 106.2 | -1.08 | 10.5 | 51.2 | 38.0 | 75.6 | 26.9 | 17.1 | 6.56 | 9.6 | 51.9 | 0.5 | 7.8 | 0.1 | 1.6 |
| Ryan Anderson | 21 | 82 | PF | 111.8 | 23.5 | 103.3 | -0.97 | 19.4 | 51.4 | 37.0 | 86.6 | 7.1 | 13.6 | -3.44 | 21.1 | 54.4 | 9.2 | 16.2 | 1.1 | 1.4 |
| Brandon Bass | 24 | 80 | PF | 111.7 | 20.4 | 103.6 | -0.02 | 16.2 | 51.1 | 0.0 | 82.5 | 5.1 | 12.2 | -2.83 | 27.0 | 0.0 | 10.0 | 12.6 | 3.1 | 1.0 |
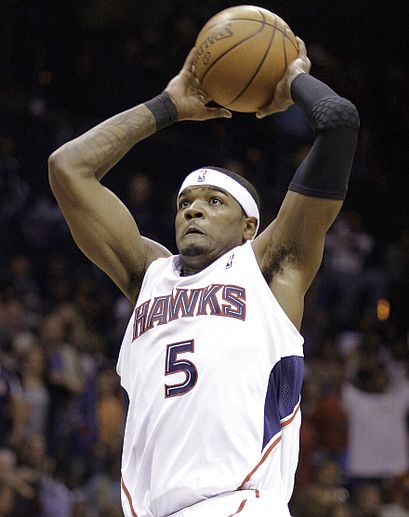
 3. Atlanta Hawks
Coach: Mike Woodson
SRS: 4.44 (7th of 30) ▪ Pace Factor: 90.1 (27th of 30)
Offensive Rating: 111.9 (2nd of 30) ▪ Defensive Rating: 106.7 (13th of 30)
How They Got Here:
Won NBA Eastern Conference First Round (4-3) versus Milwaukee Bucks
Four Factors:
| Team | eFG% | Rank | TOV% | Rank | ORB% | Rank | FT/FGA | Rank |
|---|---|---|---|---|---|---|---|---|
| Atlanta Hawks | 0.506 | 11 | 0.114 | 1 | 0.282 | 4 | 0.213 | 23 |
| Atlanta Hawks - Opp | 0.496 | 16 | 0.132 | 18 | 0.273 | 24 | 0.208 | 8 |
Roster (w/ 2010 Regular-Season Stats):
| Player | Ag | Ht | Ps | ORtg | %P | DRtg | DPA | P36 | 2P% | 3P% | FT% | AR | TR | PR | Fr | 3t | OR% | DR% | Bk% | St% |
|---|---|---|---|---|---|---|---|---|---|---|---|---|---|---|---|---|---|---|---|---|
| Joe Johnson | 28 | 80 | SG | 112.4 | 25.6 | 109.1 | -1.87 | 20.8 | 48.8 | 36.9 | 81.8 | 22.0 | 10.5 | 3.50 | 19.4 | 25.3 | 3.0 | 11.4 | 0.1 | 1.5 |
| Al Horford | 23 | 82 | C | 121.4 | 18.1 | 104.7 | 1.82 | 14.9 | 55.1 | 100.0 | 78.9 | 10.4 | 12.6 | 0.14 | 31.9 | 0.1 | 9.6 | 23.3 | 2.4 | 1.1 |
| Josh Smith | 24 | 81 | PF | 109.4 | 23.3 | 101.4 | 3.33 | 16.4 | 50.8 | 0.0 | 61.8 | 19.0 | 15.8 | 1.04 | 42.2 | 0.7 | 9.0 | 19.8 | 4.6 | 2.4 |
| Mike Bibby | 31 | 73 | PG | 112.9 | 16.4 | 109.6 | -1.09 | 12.3 | 44.4 | 38.9 | 86.1 | 20.8 | 13.3 | 5.32 | 12.3 | 50.3 | 1.1 | 8.8 | 0.1 | 1.6 |
| Marvin Williams | 23 | 81 | SF | 112.9 | 15.0 | 107.3 | 0.59 | 12.3 | 49.2 | 30.3 | 81.9 | 5.6 | 10.3 | -0.41 | 32.4 | 19.9 | 5.0 | 14.8 | 1.4 | 1.4 |
| Jamal Crawford | 29 | 78 | SG | 114.3 | 24.6 | 110.4 | -2.50 | 21.5 | 49.1 | 38.2 | 85.7 | 16.1 | 12.1 | 0.88 | 28.5 | 38.6 | 1.6 | 8.0 | 0.4 | 1.3 |
| Zaza Pachulia | 25 | 83 | C | 109.9 | 16.6 | 104.4 | 2.04 | 11.3 | 49.6 | 0.0 | 65.0 | 5.6 | 17.1 | -2.75 | 58.1 | 1.6 | 12.4 | 19.0 | 2.1 | 1.8 |
| Maurice Evans | 31 | 77 | SG | 116.9 | 14.6 | 109.5 | -1.11 | 12.7 | 52.7 | 33.7 | 75.4 | 5.5 | 5.6 | 0.91 | 15.5 | 43.0 | 5.2 | 8.5 | 1.0 | 1.4 |
| Jeff Teague | 21 | 74 | PG | 96.5 | 20.0 | 106.4 | -0.33 | 11.7 | 42.6 | 21.9 | 83.7 | 25.1 | 18.6 | 4.36 | 21.6 | 14.1 | 0.8 | 10.2 | 1.2 | 2.5 |
| Joe Smith | 34 | 82 | PF | 103.5 | 18.8 | 107.2 | 0.10 | 12.1 | 40.9 | 14.3 | 81.3 | 5.3 | 10.6 | -1.35 | 24.9 | 3.6 | 12.9 | 18.1 | 2.4 | 0.5 |
| Mario West | 25 | 77 | SG | 110.1 | 11.6 | 104.4 | 1.55 | 7.8 | 60.0 | 0.0 | 60.0 | 8.8 | 22.6 | -0.70 | 47.6 | 4.8 | 6.5 | 15.8 | 0.0 | 3.0 |
| Jason Collins | 31 | 84 | C | 73.4 | 11.8 | 108.7 | -0.02 | 5.2 | 36.4 | 0.0 | 0.0 | 4.8 | 19.7 | -2.03 | 8.7 | 4.3 | 5.0 | 9.2 | 1.3 | 1.4 |
Season Series
| Magic win series 4-0 |
|---|
| Game 1 @ ORL - Magic 114, Hawks 71 |
| Game 2 @ ORL - Magic 112, Hawks 98 |
| Game 3 @ ATL - Magic 105, Hawks 75 |
| Game 4 @ ATL - Magic 98, Hawks 84 |
| Picks | Most Likely | Second Opinion |
|---|---|---|
| SPM "True Skill" Projection says: | Magic in 5 | Magic in 7 |
| SRS says: | Magic in 5 | Magic in 7 |
| I say: | Magic in 5 | Magic in 4 |

May 3rd, 2010 at 3:35 pm
Orlando sweeps Atlanta. The magic are way under the radar of the general basketball public.
May 3rd, 2010 at 3:55 pm
My adjusted team efficiencies, converted to SPM, then converted back to team efficiency based on the expected lineups/roster.
Orlando is the 3rd best team still playing; Atlanta the 5th best.
ORL vs ATL
4 to 0 7.6%
4 to 1 18.9%
4 to 2 14.8%
4 to 3 20.8%
3 to 4 11.0%
2 to 4 15.7%
1 to 4 7.2%
0 to 4 4.0%
Margin
8.00 6.79
ORL ATL
62.1% 37.9%
May 3rd, 2010 at 6:01 pm
The Magic are significantly stronger at the Center position than the Bucks were. Even if Howard gets saddled with fouls. Zaza and Horford are not going to produce easy buckets in this series. Orlando has a few guys it can throw at Joe Johnson defensively. Josh Smith will have a lot riding on his shoulders. But if it was that hard against the depleted Bucks . . .
May 4th, 2010 at 3:47 pm
DSMok1 says Orl in 5 or 7 are both more likely than Orl in 6.
Also, that Atl in 6 is more likely than in 7 or in 5.
Neil says Orl in 7 is more likely than in 6, less likely than in 5.
I don't get the unevenness of the distribution. Does it have to do with home/away?
Also: The link shown as --
"How They Got Here:
Won NBA Eastern Conference First Round (4-3) versus Milwaukee Bucks"
-- leads to a preview of that series.
How about a statistical summary of previous series, rather than another review of the regular season?
May 4th, 2010 at 7:25 pm
The home court advantage is estimated as worth 3.7 points per 100 possessions (at least, that's my estimate over the last 10 years). If there were no home court advantage, the ORL vs. ATL distribution would look like:
ORL vs ATL
4 to 0 8.5%
4 to 1 15.6%
4 to 2 18.0%
4 to 3 16.5%
3 to 4 14.1%
2 to 4 13.1%
1 to 4 9.7%
0 to 4 4.5%
Margin
8.00 6.79
ORL ATL
58.6% 41.4%
It would also be a lot easier to calculate the series results in this case! As it is, a 7 game series is a pain as I have to calculate the odds of every different outcome (such as WWLLWW) and sum them to get the odds like these.