9th June 2011
With the NBA Finals locked up 2-2, it seems like a good time to look at the best Finals performances in our database (which extends back to 1991 for playoff games). The metric of choice is Statistical Plus-Minus, an estimate of the player's contribution to the team's point differential per 100 possessions, using his boxscore stats as inputs. And, as an added twist, I weighted each game of the Finals according to its series leverage (the expected change in series win probability of the game in question relative to the series' overall average per-game change), meaning that performance counts more in the games that contain the most pressure. Here is every player in the dataset who played a minimum of 24 minutes per team game:
Read the rest of this entry »
Posted in Analysis, Data Dump, History, Playoffs, Statgeekery, Statistical +/- | 26 Comments »
8th June 2011
Last night was the lowest-usage game of LeBron James' playoff career, according to the BBR Glossary definition of Usage%:
| Date |
Tm |
Opp |
Mp |
Fg |
3p |
Ft |
Or-Tr |
As |
St |
Bk |
To |
Pf |
Pts |
Usg% |
| 6/7/2011 |
MIA |
DAL |
45.7 |
3-11 |
0-3 |
2-4 |
3-9 |
7 |
2 |
0 |
4 |
4 |
8 |
17.9 |
| 5/21/2007 |
CLE |
DET |
45.4 |
5-15 |
0-0 |
0-0 |
1-10 |
9 |
4 |
1 |
2 |
1 |
10 |
17.9 |
| 5/31/2011 |
MIA |
DAL |
45.3 |
9-16 |
4-5 |
2-2 |
0-9 |
5 |
1 |
0 |
1 |
4 |
24 |
18.7 |
| 5/22/2011 |
MIA |
CHI |
43.9 |
6-13 |
1-2 |
9-9 |
1-6 |
10 |
2 |
2 |
0 |
4 |
22 |
20.7 |
| 4/27/2011 |
MIA |
PHI |
41.7 |
5-13 |
2-5 |
4-5 |
3-10 |
8 |
1 |
0 |
3 |
2 |
16 |
20.8 |
| 4/21/2011 |
MIA |
PHI |
44.3 |
8-15 |
1-4 |
7-10 |
1-15 |
6 |
1 |
0 |
1 |
1 |
24 |
21.2 |
| 6/2/2007 |
CLE |
DET |
46.2 |
3-11 |
0-2 |
14-19 |
2-14 |
8 |
2 |
2 |
3 |
1 |
20 |
21.3 |
| 4/22/2007 |
CLE |
WAS |
44.3 |
7-14 |
0-2 |
9-11 |
2-9 |
7 |
2 |
0 |
1 |
1 |
23 |
21.5 |
| 6/5/2011 |
MIA |
DAL |
45.3 |
6-14 |
1-4 |
4-4 |
0-3 |
9 |
2 |
0 |
4 |
3 |
17 |
22.2 |
| 4/27/2010 |
CLE |
CHI |
43.2 |
5-12 |
1-2 |
8-14 |
3-10 |
9 |
0 |
2 |
3 |
1 |
19 |
23.9 |
It also tied for the fewest shots he ever took in a playoff game, and represented the fewest points he ever scored in a playoff game.
Posted in Playoffs, Statgeekery, Trivia | 50 Comments »
8th June 2011
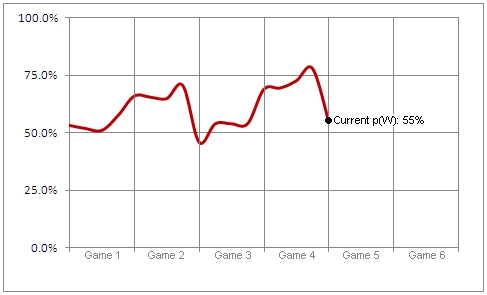
Miami's Series Win Probability Graph after Game 4 (Series tied 2-2):

Miami's Quarter-by-Quarter Series Win Probability Data:
| Minutes Elapsed |
p(win) |
| 0 |
53.3% |
| Game 1 |
| 12 |
52.0% |
| 24 |
51.2% |
| 36 |
57.7% |
| 48 |
66.2% |
| Game 2 |
| 60 |
65.7% |
| 72 |
65.1% |
| 84 |
70.7% |
| 96 |
46.0% |
| Game 3 |
| 108 |
54.0% |
| 120 |
54.0% |
| 132 |
54.1% |
| 144 |
69.1% |
| Game 4 |
| 156 |
69.7% |
| 168 |
72.8% |
| 180 |
78.3% |
| 192 |
55.2% |
(For more info on the Series Win Probability methodology, click here)
Posted in Playoffs, Statgeekery | 37 Comments »
5th June 2011
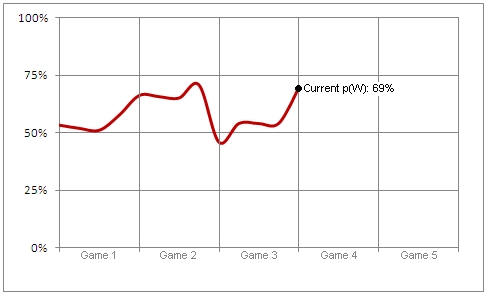
Miami's Series Win Probability Graph after Game 3 (Miami leads 2-1):

Miami's Quarter-by-Quarter Series Win Probability Data:
| Minutes Elapsed |
p(win) |
| 0 |
53% |
| Game 1 |
| 12 |
52% |
| 24 |
51% |
| 36 |
58% |
| 48 |
66% |
| Game 2 |
| 60 |
66% |
| 72 |
65% |
| 84 |
71% |
| 96 |
46% |
| Game 3 |
| 108 |
54% |
| 120 |
54% |
| 132 |
54% |
| 144 |
69% |
(For more info on the Series Win Probability methodology, click here)
Posted in Playoffs, Statgeekery | 40 Comments »
3rd June 2011
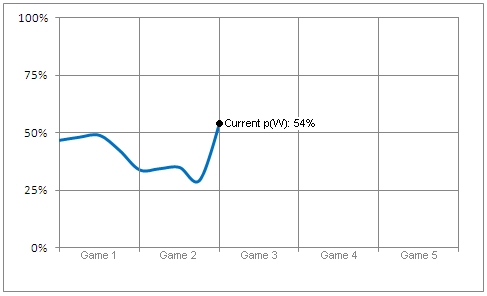
Dallas' Series Win Probability Graph after Game 2:

Dallas' Quarter-by-Quarter Series Win Probability Data:
| Minutes Elapsed |
p(win) |
| 0 |
47% |
| 12 |
48% |
| 24 |
49% |
| 36 |
42% |
| 48 |
34% |
| 60 |
34% |
| 72 |
35% |
| 84 |
29% |
| 96 |
54% |
(For more info on the Series Win Probability methodology, click here)
Honestly, just looking at the quarter-by-quarter stats vastly understates the magnitude of Dallas' comeback.
They were down 88-73 with 6 minutes and 19 seconds left in the game. Using the win probability methodology Wayne Winston laid out in Mathletics, a team winning by 15 at home with 6.32 minutes left in the game should win 99.978% of the time, putting the chances of a Dallas comeback at 1 in 4,550. As a second opinion, Ed Kupfer's win probability metric says a team winning by 15 at home with 6:19 to play should win 99.592% of the time, making the Mavs' comeback a 1 in 245 proposition.
Either way, Miami was less than a half of a percentage point away from taking a 2-0 lead to Dallas and giving themselves a 79% probability of winning a championship. Instead, they now sit at 46%. It's not quite on the level of Dallas blowing a 90% chance in 2006... but it's shockingly close.
Posted in Playoffs, Statgeekery | 33 Comments »
1st June 2011
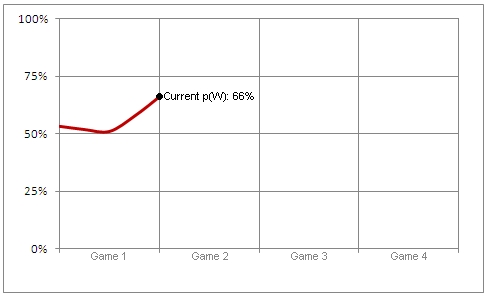
Miami's Series Win Probability Graph after Game 1:

Miami's Quarter-by-Quarter Series Win Probability Data:
| Minutes Elapsed |
p(win) |
| 0 |
53.3% |
| 12 |
52.0% |
| 24 |
51.2% |
| 36 |
57.7% |
| 48 |
66.0% |
For more info on the Series Win Probability methodology, click here.
Posted in Playoffs, Statgeekery | 22 Comments »
31st May 2011
With Dallas-Miami Part II tipping off tonight (not that it's really a rematch), I wanted to see whether the Mavs' loss in 2006 was the worst Finals collapse of the BBR era. We have linescores for every playoff game since 1992, which means I can calculate the home team's probability of winning at various checkpoints within a game:
| Stage |
p(Home W) |
| Pregame |
60.4% |
| After 1st Qtr |
=1/(1+EXP(-0.3599755-0.1122741*Home Margin)) |
| After 2nd Qtr |
=1/(1+EXP(-0.2895922-0.1429087*Home Margin)) |
| After 3rd Qtr |
=1/(1+EXP(-0.2041572-0.2117494*Home Margin)) |
| Before any OT |
52.4% |
Combining those probabilities with the series win probabilities I found here, one can determine each team's probability of winning the series at a given checkpoint. This allows us to rank Finals collapses, pinpointing the moments within games where the eventual loser's series win probability was the highest:
Read the rest of this entry »
Posted in Analysis, History, Playoffs, Statgeekery | 13 Comments »
30th May 2011
Although we like to think "the best team always wins a best-of-7 series", variance plays a much bigger role than we'd care to admit. I found here that the best team in a given season usually wins the NBA title about 48% of the time -- and that's actually an incredibly high rate compared to other sports like baseball (29%), pro football (24%), and college basketball (34%).
Truth be told, playoffs are mainly designed as entertainment, with "finding the best team" as a secondary goal. And there's nothing wrong with that. If we forced teams to play enough to have statistical certainty, it would require a completely impractical number of games. For the fan's sake, it is necessary to achieve a balance between watchability and the feeling that what we watched wasn't a total fluke. And really, the NBA probably does this better than any other sport.
But we still have to acknowledge that the best team does not always win, nor do the NBA Finals necessarily contain the best teams in each conference. Can we put a number on how probable it is that a given Finals matchup did in fact contain the best from each conference? Using a very simplified version of Prof. Jesse Frey's Method for determining the probability that a given team was the true best team in some particular year (with assists from these posts), I calculated that probability for every Finals matchup since 1984, when the playoffs expanded to 16 teams.
Here are those Finals, ranked from the greatest certainty that the two teams were their respective conferences' best to the least certainty:
Read the rest of this entry »
Posted in Analysis, History, Playoffs, Statgeekery | 10 Comments »
28th May 2011
Miami Heat
58-24, 1st in NBA Southeast Division (Schedule and Results)
Coach: Erik Spoelstra (58-24)
PTS/G: 102.1 (8th of 30) ▪ Opp PTS/G: 94.6 (6th of 30)
SRS: 6.76 (1st of 30) ▪ Pace: 90.9 (20th of 30)
Off Rtg: 111.7 (3rd of 30) ▪ Def Rtg: 103.5 (5th of 30)
Expected W-L: 61-21 (2nd of 30)
Arena: AmericanAirlines Arena ▪ Attendance: 810,930 (4th of 30)
Playoffs:
NBA Finals versus Dallas Mavericks
Won NBA Eastern Conference Finals (4-1) versus Chicago Bulls
Won NBA Eastern Conference Semifinals (4-1) versus Boston Celtics
Won NBA Eastern Conference First Round (4-1) versus Philadelphia 76ers
Read the rest of this entry »
Posted in Playoffs, SRS, Statgeekery, Statistical +/-, Win Shares | 8 Comments »


