17th June 2010
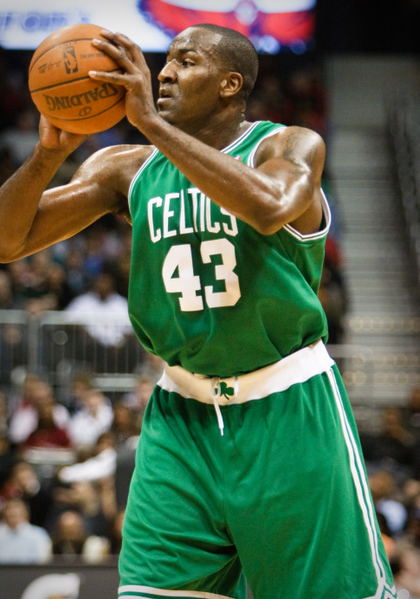
 At first glance, Kendrick Perkins' knee injury early in Game 6 may seem like only a minor setback for the Boston Celtics -- after all, Perkins has scored just 8.5 PPG in the Big Three Era, and while his rebounding and defense are solid, he's never finished in the top 10 in RPG or garnered All-Defense honors. However, despite his lack of box score presence, Perkins has been highly important to the Celtics' chances this season: when he plays less than 22 minutes in a game, Boston is 5-8, including Tuesday's ugly loss and a similar beatdown suffered vs. Orlando in the Conference Finals when Perkins was limited by foul trouble.
We can really illustrate Perkins' hidden importance by looking at the Plus/Minus numbers. When Perkins was on the court for Boston this season, the Celtics outscored their opponents by 7.2 points per 100 possessions; when he wasn't playing, that number was only +0.2, a difference of -7 pts/100 poss. The same story has been true since Perkins became a regular starter in 2006-07: putting together a rudimentary game-by-game "with or without you" regression (similar to what I did in this post) between team HCA-adjusted PPG differential and whether or not a player played 17 minutes in the game (the MPG that usually indicates a "contributor"), Perkins shows up as adding +2.18 PPG to Boston's differential when he's a contributor vs. when he plays limited minutes or less.
Meanwhile, Perkins' Game 7 replacements, Rasheed Wallace and Glen Davis, don't fare nearly as well by the WOWOY metrics. Despite Davis' heroics in Game 4, he and Wallace have been Boston's two worst players by net on/off rating during the playoffs. Wallace has been particularly toxic for the Celtics all season -- the team played 5 pts/100 poss. worse when he was on the floor, as evidenced by his recurring appearance in the Celts' worst lineup combinations. Davis & Wallace look better by the 4-year WOWOY regression (Davis is +1.36, Wallace is +0.47), but neither has the ability to positively impact the game the way Perkins does. Without his presence, and playing on the road (home teams win Game 7 80% of the time), the Celtics appear to be in dire straits tonight.
Posted in Analysis, Playoffs, Statgeekery | 9 Comments »
16th June 2010
As a follow-up to this morning's post about historical 7-game series, here are some notes about the "shape" of this year's Finals...
First, what I mean by "shape" is the pattern of wins and losses by the home team in the series. For instance, the 2010 Finals look like this:
WLLWWW
In other words, the home team won Game 1, lost Games 2 & 3, and then won Games 4, 5, & 6. How often has that happened through the first 6 games of a 7-game series?
Read the rest of this entry »
Posted in Analysis, Just For Fun, Playoffs | 6 Comments »
16th June 2010
The Lakers needed to win last night to force a 7th game in the NBA Finals, and they didn't disappoint, delivering a brutal 89-67 beatdown that evened the series at 3 wins apiece. In NBA playoff history, this is the 105th series to go 7 games, and the 17th time the Finals have gone the distance. It should be a fitting finish to the season, and the capper to a thrilling 7-game Championship series with a razor-thin margin between the two teams...
Or has it really been that razor-thin? In the series, the Lakers have outscored the Celtics by 20 points after 6 games. Is that a lot, or a normal amount for a 7-game series? How does that compare to the margins of past 7-game playoff series through 6 games?
Read the rest of this entry »
Posted in Analysis, Playoffs, Statgeekery | 15 Comments »
15th June 2010
Last week, I took a look at Kobe Bryant's performance vs. the Boston Celtics in Games 1-3 of the Finals, and how it compared to his performance against them in 2008, as well as LeBron James' performance against them a month ago. With 2 more games having passed, it's time to update the numbers:
Read the rest of this entry »
Posted in Analysis, Playoffs, Statgeekery | 18 Comments »
14th June 2010
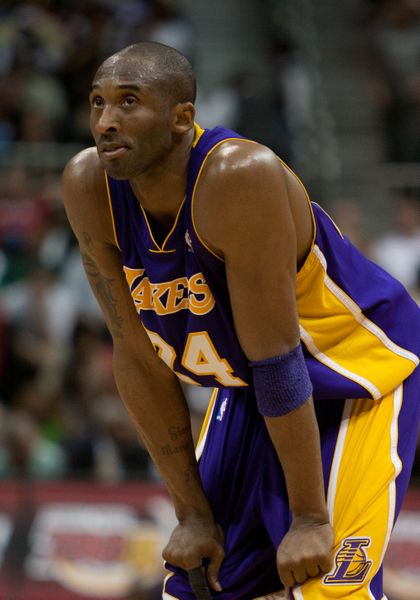
Last night, Kobe Bryant boldly attempted to take over Game 5 of the Finals, pouring in 23 consecutive Laker points in the 3rd quarter on a collection of the toughest shots you'll ever see. However, L.A. couldn't get stops during that span, and nobody but Bryant was scoring, so the Celtics were actually able to extend their lead even as Kobe's outburst was taking place. Bryant finished the game with 38 points, but half of them came in that 8-minute stretch during the 3rd quarter, and he couldn't will L.A. to a late-game charge even as Boston seemed on the verge of a collapse in the final minutes.
The frustration was apparent in Bryant's expressions and body language throughout the 4th quarter, as Kobe was unable to do any damage from the floor in the final 8 minutes of the game. But despite his failure to drive a stake into the Celtics' hearts in crunch time, Bryant's performance was still one of the most valiant in recent Finals history by a member of the losing team. According to Statistical +/-, here are the best individual performances in a Finals loss (minimum 30 minutes played):
Read the rest of this entry »
Posted in Analysis, Playoffs, Statistical +/- | 24 Comments »
11th June 2010
Led by Glen Davis (18 pts, 5 reb) and a superb relief performance by the bench in general, the Celtics scrapped their way to a 96-89 win in Game 4 of the Finals, drawing the championship series even at 2 games apiece. Just how good were the Boston reserve corps last night? Since 1991, here are the teams that received the biggest Win Share boosts from non-starters in a Finals game:
Read the rest of this entry »
Posted in Analysis, Playoffs, Win Shares | 6 Comments »
10th June 2010
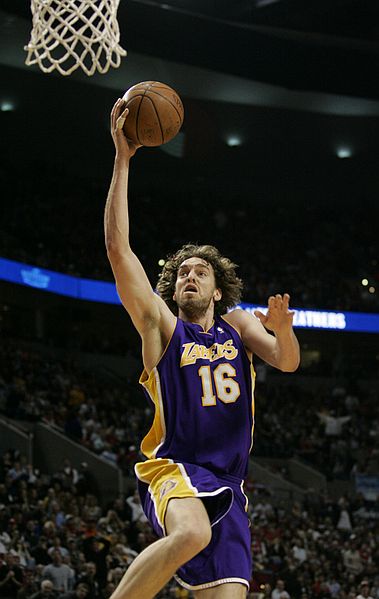
 During yesterday's Kobe Bryant discussion, an interesting point was raised about just what it will take for Laker second banana Pau Gasol to be named Finals MVP this season. My rhetorical question on the matter was this:
"I wonder if an established best player on a team has a sort of "incumbent effect" when it comes to Finals MVPs? In other words, how badly would Kobe have to play -- and how well would Gasol have to play -- for Kobe not to be named Finals MVP? [...] What kind of handicap does a 2nd banana have when trying to overcome the Alpha Dog for Finals MVP?"
Today I want to look at this phenomenon statistically, and see how often the winning team's agreed-upon "best player" won Finals MVP honors, how the second bananas' numbers compared to the Alpha Dogs' during the Finals, and hopefully determine what kind of handicap a non-"Alpha Dog " faces when vying for the award.
Read the rest of this entry »
Posted in Analysis, History, Playoffs | 31 Comments »
9th June 2010
 If you listened to any of the hype in the days leading up to Game 1 of the Finals, you know that this Lakers-Celtics series was going to be seen as a referendum on two things: how much Kobe Bryant (and the Lakers as a team) have improved since 2008, and which player is better in the Kobe-LeBron debate. Conveniently for the casual fan, the common opponent in all three cases (Lakers-Celts 2008, Celts-Cavs 2010, & Lakers-Celts 2010) is the Boston Celtics, a team that -- superficially, at least -- has changed very little in the past few years, making for an easy and seemingly valid measuring stick.
I won't debate the validity of this assumption any more than to point out that more has changed for the Celtics since 2008 than meets the eye. But say for the purposes of argument that the basic premise is valid, that you can straight-up compare Kobe '08, Kobe '10, and LeBron '10 on the basis of their performance against a common playoff foe... Who looks better after 3 games?
Read the rest of this entry »
Posted in Analysis, Playoffs | 54 Comments »
8th June 2010
 A few weeks ago, I looked at various players' career performances in "crucial games", which I defined as: "Game 3 or later in a 7-game series; Conference Semifinals or later; series tied, within 1 game either way, or an elimination game for the trailing team". But while that's a nice working definition, it's certainly far from universal; for instance, one commenter pointed out that an elimination game when down 3-0 isn't very "crucial" at all, because even if you win, it doesn't really do a lot to change the outcome of the series.
Now, I had been operating under the assumption that you still feel pressure as a player even when facing an insurmountable deficit (maybe you even feel the most pressure under those circumstances), but I can see where performing well in that kind of game doesn't really carry the same weight as the same performance in, say, a Game 7. It's a bit like that old criticism of Alex Rodriguez -- he only hits home runs when the score is lopsided (that isn't true, by the way, but it was an actual criticism they lobbed at A-Rod for a while before the Yankees won a World Series with him). A solo HR always counts for exactly 1 run, of course, but if you look at Win Probability Added, that HR can take on wildly different win values depending on the situation. The same goes for wins in a 7-game series -- winning Game 5 when it's tied 2-2 is more important than winning Game 5 when you're down 3-1.
Read the rest of this entry »
Posted in Analysis, Playoffs, Statgeekery | 24 Comments »
5th June 2010
 Note: This post was originally published at College Basketball Reference, S-R's brand-new College Hoops site, so when you're done reading, go over and check it out!
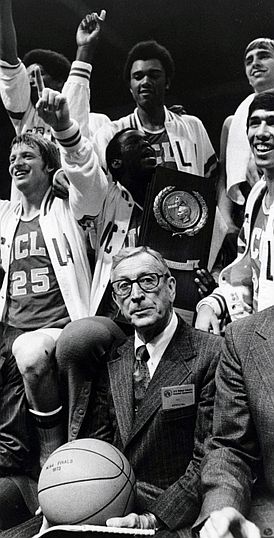
When the great John Wooden passed away on Friday at the age of 99, he left behind a staggering resume, arguably the most dominant winning legacy of any coach in any sport. Wooden won 10 championships at the helm of the UCLA Bruins during the 1960s and 70s, including an astonishing run of 7 straight titles from 1967-73; in the annals of basketball history, the only coach whose run of dominance is even on par with Wooden's is his NBA contemporary, Red Auerbach. Of course, Wooden was more than just a great coach -- and I'll leave the kind words about Wooden as a human being (of which there are many) to better writers than I -- but I did want to take a statistical look at just how amazing his coaching career was.
Exactly how impressive was Wooden's run in the 60s and early 70s? One measure of coaching greatness is the ability to resist the "pull of parity" -- since a .500 record relentlessly tugs at good teams and bad ones alike, drawing them inexorably toward the mean if given enough seasons, sustained greatness like Wooden's suggests a significant amount of skill. In the NCAA Tournament era (1939-present), we can quantify the pull of parity on any school thusly:
Expected Win % = 0.235 + 0.552*Previous Season Win %
This means that a team that won 88% of its games last year (for instance, Duke in 2010) should only expect to win 72% of its games next year, because parity wants to drag them toward .500. The assumption we're going to use is that if Duke ends up winning more than 72% of their games, it would be an indicator of Mike Krzyzewski's coaching skill.
So back to Coach Wooden... Here's his career coaching record, alongside his school's expected Win % every year, and the number of wins by which he exceeded that expectation:
Read the rest of this entry »
Posted in Analysis, History, NCAA | 10 Comments »
 At first glance, Kendrick Perkins' knee injury early in Game 6 may seem like only a minor setback for the Boston Celtics -- after all, Perkins has scored just 8.5 PPG in the Big Three Era, and while his rebounding and defense are solid, he's never finished in the top 10 in RPG or garnered All-Defense honors. However, despite his lack of box score presence, Perkins has been highly important to the Celtics' chances this season: when he plays less than 22 minutes in a game, Boston is 5-8, including Tuesday's ugly loss and a similar beatdown suffered vs. Orlando in the Conference Finals when Perkins was limited by foul trouble.
 During
  If you listened to any of the hype in the days leading up to Game 1 of the Finals, you know that this Lakers-Celtics series was going to be seen as a referendum on two things: how much
 Note: This post was originally published at